Calculating engine Horse Power from acceleration and freewheeling data.
Following is downloadable Excel file for making this calculation..
click the icon to view and to save the file.
. . . . . .
The following descibes what this is all about. . .
This is the test of an article in "Spare Parts" May 2001, the magazine of the Constructors car Club, Wellington NewZealand. . . . .
Your Living-Room Engine Dynamometer
Now, this might seem a little far fetched, but you don't really have to take your car down to the dyno shop to find out it's horsepower, you probably have all the technology you need already sitting there in your living room.
OK, here's the whole story as briefly put as I can make it.
Commonly automotive dynamometers use some sort of energy absorbing device to hold back the engine so that its power at a particular speed (rpm) can be measured as torque. Then by making the calculation: power = torque x revs, the power is derived for that particular rpm. Another method is to attach the engine to a large flywheel. The engine then accelerates the flywheel from low revs up to top revs and the power can be worked out by logging the rotational velocity (rpm) of the flywheel against time. The power output can then be calculated from the mass of the flywheel and its rotational acceleration.
Then I thought, if instead of using a flywheel as an inertial mass, the mass of the car itself is used, then you can work out the power of the car just by measuring its velocity and acceleration. One problem with this idea is that it fails to take into account the power that is lost in overcoming the rolling resistance of the car, and wind resistance. But this can be addressed by letting the car freewheel and measuring the deceleration without using engine or brakes.

Enough of the theory, time for action. On Easter Sunday I taped my watch onto the RoadRat "dashboard" next to the speedo, and mounted our old video camera onto a wooden frame so as to record the gauges. I then headed for a bit of flat open road with light traffic and between bunches of traffic did several runs in each direction. Each run was full throttle from about 20 kph to 100 kph in third gear, letting the car coast back down to 20 kph after each "power" run. This all took less than 10 minutes and produced no real dramas except for one run where I had to wait for some traffic to go passed before I started the run. I misjudged the lead time I needed to give the other traffic, and caught it up half way through the "freewheeling". I almost had to abort the run.
I then spent some rather tedious hours playing back the video-tape frame by frame and making tables of kph from the speedo and seconds from the watch. Plotting these data using Excel I was surprised and pleased to find really good agreement between the runs and I was able to make good "smoothed average" datasets for acceleration and freewheeling to use for the next stage. Unfortunately I was not able to get such a good correlation between the speedo and the rev-counter. At best one of them seems to be at least 5% out for much of the range, but I can't tell which one. This probably compromises the results I got significantly.
Knowing the weight of the car + gear + driver I was able to calculate the acceleration forces for each velocity increment, and thence the power being used to overcome the inertial mass of the car. Then using the deceleration data, I could calculate the forces and power that was decelerating the car for the same velocity intervals. These drag forces are the same at the same speed whether accelerating or decelerating and during the acceleration runs the engine was overcoming both the inertial and these drag forces. So the power of the engine is the sum of these two separately determined "powers".
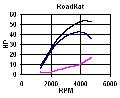
By now you will have given up reading and already had a look at the graph, so I should explain it. The top line is the sum of the accelerating and the freewheeling HP for each rpm step. This is the power that is delivered at the wheels. I think the coasting down exercise will not fully account for transmission losses, as these are much less when the engine is not working. I confess I would have been pleased if the figures were a bit higher, but this HP does compare well with VW engine dyno results that I have seen in books.
An interesting additional exercise is the determination of wind drag factor that can also be deduced from these data. I assumed that the total drag was made up from rolling resistance, which is proportional to speed, and wind resistance, which is proportional to speed squared. By measuring the cross-sectional area of the car the two variables are the drag coefficient Cd and a constant rolling resistance force "R". I could then play around with trial values of Cd and R to get as good a fit as possible with the "freewheeling" curve.
The basic input data I used was:
Weight of car etc.: 705 kg rpm conversion: 20 kph/1000rpm (third gear) Power: 1 HP = 0.75 kw
Results
Power. I got about 53 HP "at the wheels". Not much, but probably realistic.
Rolling resistance. I got about 15kg, which is about the same value as I got by pushing the car along in the garage with the bathroom scales.
Cd. I got about 0.65 . This compares with a brick which is about 1.2 (small end first) but not as good as most modern saloon cars which I believe have Cds as low as 0.36 , or a cannon ball which is only 0.2 . This value depends very much on how you calculate the cross-sectional area of the car. References say this should be the largest cross-section, but I suspect this is unrealistic for an open car where the sections change so suddenly at points like behind the windscreen. The RoadRat's largest section is actually through the rear wheels. I used a front view outline profile as the cross-section for the calculations I did.

Over-all
I suspect the theory I used is sound enough, but the accuracy of the data used is not really adequate to give the results much credibility. The velocity and time relationship is very critical. A change of just 0.2kph in any of the readings can make a 10HP difference in the power calculation. The speedo is just not an accurate enough instrument when used in this way. If you want to know what power you've got, it's best to go to the Dyno shop and pay the man the money.
. . . . . . . . . . . .